Logging Architecture
Application logs can help you understand what is happening inside your application. The logs are particularly useful for debugging problems and monitoring cluster activity. Most modern applications have some kind of logging mechanism. Likewise, container engines are designed to support logging. The easiest and most adopted logging method for containerized applications is writing to standard output and standard error streams.
However, the native functionality provided by a container engine or runtime is usually not enough for a complete logging solution.
For example, you may want to access your application's logs if a container crashes, a pod gets evicted, or a node dies.
In a cluster, logs should have a separate storage and lifecycle independent of nodes, pods, or containers. This concept is called cluster-level logging.
Cluster-level logging architectures require a separate backend to store, analyze, and query logs. Kubernetes does not provide a native storage solution for log data. Instead, there are many logging solutions that integrate with Kubernetes. The following sections describe how to handle and store logs on nodes.
Pod and container logs
Kubernetes captures logs from each container in a running Pod.
This example uses a manifest for a Pod with a container
that writes text to the standard output stream, once per second.
apiVersion: v1
kind: Pod
metadata:
  name: counter
spec:
  containers:
  - name: count
    image: busybox:1.28
    args: [/bin/sh, -c,
            'i=0; while true; do echo "$i: $(date)"; i=$((i+1)); sleep 1; done']
To run this pod, use the following command:
kubectl apply -f https://k8s.io/examples/debug/counter-pod.yaml
The output is:
pod/counter created
To fetch the logs, use the kubectl logs command, as follows:
kubectl logs counter
The output is similar to:
0: Fri Apr  1 11:42:23 UTC 2022
1: Fri Apr  1 11:42:24 UTC 2022
2: Fri Apr  1 11:42:25 UTC 2022
You can use kubectl logs --previous to retrieve logs from a previous instantiation of a container.
If your pod has multiple containers, specify which container's logs you want to access by
appending a container name to the command, with a -c flag, like so:
kubectl logs counter -c count
Container log streams
FEATURE STATE:
Kubernetes v1.32 [alpha](disabled by default)As an alpha feature, the kubelet can split out the logs from the two standard streams produced
by a container: standard output
and standard error.
To use this behavior, you must enable the PodLogsQuerySplitStreams
feature gate.
With that feature gate enabled, Kubernetes 1.37 allows access to these
log streams directly via the Pod API. You can fetch a specific stream by specifying the stream name (either Stdout or Stderr),
using the stream query string. You must have access to read the log subresource of that Pod.
To demonstrate this feature, you can create a Pod that periodically writes text to both the standard output and error stream.
apiVersion: v1
kind: Pod
metadata:
  name: counter-err
spec:
  containers:
  - name: count
    image: busybox:1.28
    args: [/bin/sh, -c,
            'i=0; while true; do echo "$i: $(date)"; echo "$i: err" >&2 ; i=$((i+1)); sleep 1; done']
To run this pod, use the following command:
kubectl apply -f https://k8s.io/examples/debug/counter-pod-err.yaml
To fetch only the stderr log stream, you can run:
kubectl get --raw "/api/v1/namespaces/default/pods/counter-err/log?stream=Stderr"
See the kubectl logs documentation
for more details.
How nodes handle container logs
A container runtime handles and redirects any output generated to a containerized
application's stdout and stderr streams.
Different container runtimes implement this in different ways; however, the integration
with the kubelet is standardized as the CRI logging format.
By default, if a container restarts, the kubelet keeps one terminated container with its logs. If a pod is evicted from the node, all corresponding containers are also evicted, along with their logs.
The kubelet makes logs available to clients via a special feature of the Kubernetes API.
The usual way to access this is by running kubectl logs.
Log rotation
FEATURE STATE:
Kubernetes v1.21 [stable]The kubelet is responsible for rotating container logs and managing the logging directory structure. The kubelet sends this information to the container runtime (using CRI), and the runtime writes the container logs to the given location.
You can configure two kubelet configuration settings,
containerLogMaxSize (default 10Mi) and containerLogMaxFiles (default 5),
using the kubelet configuration file.
These settings let you configure the maximum size for each log file and the maximum number of
files allowed for each container respectively.
In order to perform an efficient log rotation in clusters where the volume of the logs generated by
the workload is large, kubelet also provides a mechanism to tune how the logs are rotated in
terms of how many concurrent log rotations can be performed and the interval at which the logs are
monitored and rotated as required.
You can configure two kubelet configuration settings,
containerLogMaxWorkers and containerLogMonitorInterval using the
kubelet configuration file.
When you run kubectl logs as in
the basic logging example, the kubelet on the node handles the request and
reads directly from the log file. The kubelet returns the content of the log file.
Note:
Only the contents of the latest log file are available through kubectl logs.
For example, if a Pod writes 40 MiB of logs and the kubelet rotates logs
after 10 MiB, running kubectl logs returns at most 10MiB of data.
System component logs
There are two types of system components: those that typically run in a container, and those components directly involved in running containers. For example:
- The kubelet and container runtime do not run in containers. The kubelet runs your containers (grouped together in pods)
- The Kubernetes scheduler, controller manager, and API server run within pods
(usually static Pods).
The etcd component runs in the control plane, and most commonly also as a static pod.
If your cluster uses kube-proxy, you typically run this as a
DaemonSet.
Log locations
The way that the kubelet and container runtime write logs depends on the operating system that the node uses:
On Linux nodes that use systemd, the kubelet and container runtime write to journald
by default. You use journalctl to read the systemd journal; for example:
journalctl -u kubelet.
If systemd is not present, the kubelet and container runtime write to .log files in the
/var/log directory. If you want to have logs written elsewhere, you can indirectly
run the kubelet via a helper tool, kube-log-runner, and use that tool to redirect
kubelet logs to a directory that you choose.
By default, kubelet directs your container runtime to write logs into directories within
/var/log/pods.
For more information on kube-log-runner, read System Logs.
By default, the kubelet writes logs to files within the directory C:\var\logs
(notice that this is not C:\var\log).
Although C:\var\log is the Kubernetes default location for these logs, several
cluster deployment tools set up Windows nodes to log to C:\var\log\kubelet instead.
If you want to have logs written elsewhere, you can indirectly
run the kubelet via a helper tool, kube-log-runner, and use that tool to redirect
kubelet logs to a directory that you choose.
However, by default, kubelet directs your container runtime to write logs within the
directory C:\var\log\pods.
For more information on kube-log-runner, read System Logs.
For Kubernetes cluster components that run in pods, these write to files inside
the /var/log directory, bypassing the default logging mechanism (the components
do not write to the systemd journal). You can use Kubernetes' storage mechanisms
to map persistent storage into the container that runs the component.
Kubelet allows changing the pod logs directory from default /var/log/pods
to a custom path. This adjustment can be made by configuring the podLogsDir
parameter in the kubelet's configuration file.
Caution:
It's important to note that the default location /var/log/pods has been in use for
an extended period and certain processes might implicitly assume this path.
Therefore, altering this parameter must be approached with caution and at your own risk.
Another caveat to keep in mind is that the kubelet supports the location being on the same
disk as /var. Otherwise, if the logs are on a separate filesystem from /var,
then the kubelet will not track that filesystem's usage, potentially leading to issues if
it fills up.
For details about etcd and its logs, view the etcd documentation. Again, you can use Kubernetes' storage mechanisms to map persistent storage into the container that runs the component.
Note:
If you deploy Kubernetes cluster components (such as the scheduler) to log to a volume shared from the parent node, you need to consider and ensure that those logs are rotated. Kubernetes does not manage that log rotation.
Your operating system may automatically implement some log rotation - for example,
if you share the directory /var/log into a static Pod for a component, node-level
log rotation treats a file in that directory the same as a file written by any component
outside Kubernetes.
Some deploy tools account for that log rotation and automate it; others leave this as your responsibility.
Cluster-level logging architectures
While Kubernetes does not provide a native solution for cluster-level logging, there are several common approaches you can consider. Here are some options:
- Use a node-level logging agent that runs on every node.
- Include a dedicated sidecar container for logging in an application pod.
- Push logs directly to a backend from within an application.
Using a node logging agent
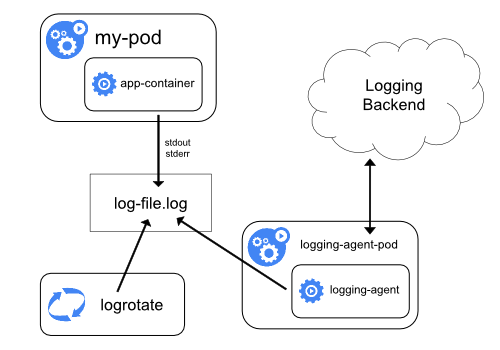
You can implement cluster-level logging by including a node-level logging agent on each node. The logging agent is a dedicated tool that exposes logs or pushes logs to a backend. Commonly, the logging agent is a container that has access to a directory with log files from all of the application containers on that node.
Because the logging agent must run on every node, it is recommended to run the agent
as a DaemonSet.
Node-level logging creates only one agent per node and doesn't require any changes to the applications running on the node.
Containers write to stdout and stderr, but with no agreed format. A node-level agent collects these logs and forwards them for aggregation.
Using a sidecar container with the logging agent
You can use a sidecar container in one of the following ways:
- The sidecar container streams application logs to its own
stdout. - The sidecar container runs a logging agent, which is configured to pick up logs from an application container.
Streaming sidecar container
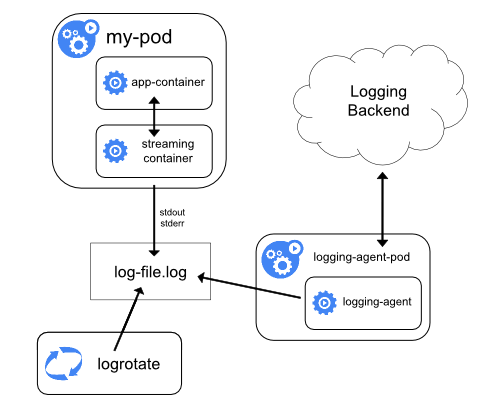
By having your sidecar containers write to their own stdout and stderr
streams, you can take advantage of the kubelet and the logging agent that
already run on each node. The sidecar containers read logs from a file, a socket,
or journald. Each sidecar container prints a log to its own stdout or stderr stream.
This approach allows you to separate several log streams from different
parts of your application, some of which can lack support
for writing to stdout or stderr. The logic behind redirecting logs
is minimal, so it's not a significant overhead. Additionally, because
stdout and stderr are handled by the kubelet, you can use built-in tools
like kubectl logs.
For example, a pod runs a single container, and the container writes to two different log files using two different formats. Here's a manifest for the Pod:
apiVersion: v1
kind: Pod
metadata:
  name: counter
spec:
  containers:
  - name: count
    image: busybox:1.28
    args:
    - /bin/sh
    - -c
    - >
      i=0;
      while true;
      do
        echo "$i: $(date)" >> /var/log/1.log;
        echo "$(date) INFO $i" >> /var/log/2.log;
        i=$((i+1));
        sleep 1;
      done
    volumeMounts:
    - name: varlog
      mountPath: /var/log
  volumes:
  - name: varlog
    emptyDir: {}
It is not recommended to write log entries with different formats to the same log
stream, even if you managed to redirect both components to the stdout stream of
the container. Instead, you can create two sidecar containers. Each sidecar
container could tail a particular log file from a shared volume and then redirect
the logs to its own stdout stream.
Here's a manifest for a pod that has two sidecar containers:
apiVersion: v1
kind: Pod
metadata:
  name: counter
spec:
  containers:
  - name: count
    image: busybox:1.28
    args:
    - /bin/sh
    - -c
    - >
      i=0;
      while true;
      do
        echo "$i: $(date)" >> /var/log/1.log;
        echo "$(date) INFO $i" >> /var/log/2.log;
        i=$((i+1));
        sleep 1;
      done
    volumeMounts:
    - name: varlog
      mountPath: /var/log
  - name: count-log-1
    image: busybox:1.28
    args: [/bin/sh, -c, 'tail -n+1 -F /var/log/1.log']
    volumeMounts:
    - name: varlog
      mountPath: /var/log
  - name: count-log-2
    image: busybox:1.28
    args: [/bin/sh, -c, 'tail -n+1 -F /var/log/2.log']
    volumeMounts:
    - name: varlog
      mountPath: /var/log
  volumes:
  - name: varlog
    emptyDir: {}
Now when you run this pod, you can access each log stream separately by running the following commands:
kubectl logs counter count-log-1
The output is similar to:
0: Fri Apr  1 11:42:26 UTC 2022
1: Fri Apr  1 11:42:27 UTC 2022
2: Fri Apr  1 11:42:28 UTC 2022
...
kubectl logs counter count-log-2
The output is similar to:
Fri Apr  1 11:42:29 UTC 2022 INFO 0
Fri Apr  1 11:42:30 UTC 2022 INFO 0
Fri Apr  1 11:42:31 UTC 2022 INFO 0
...
If you installed a node-level agent in your cluster, that agent picks up those log streams automatically without any further configuration. If you like, you can configure the agent to parse log lines depending on the source container.
Even for Pods that only have low CPU and memory usage (order of a couple of millicores
for cpu and order of several megabytes for memory), writing logs to a file and
then streaming them to stdout can double how much storage you need on the node.
If you have an application that writes to a single file, it's recommended to set
/dev/stdout as the destination rather than implement the streaming sidecar
container approach.
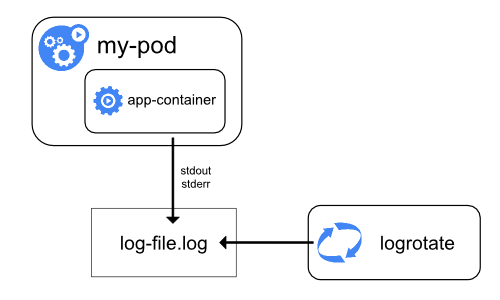
Sidecar containers can also be used to rotate log files that cannot be rotated by
the application itself. An example of this approach is a small container running
logrotate periodically.
However, it's more straightforward to use stdout and stderr directly, and
leave rotation and retention policies to the kubelet.
Sidecar container with a logging agent
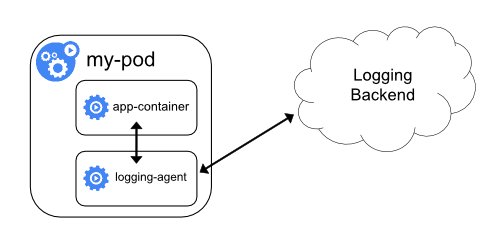
If the node-level logging agent is not flexible enough for your situation, you can create a sidecar container with a separate logging agent that you have configured specifically to run with your application.
Note:
Using a logging agent in a sidecar container can lead to significant resource consumption. Moreover, you won't be able to access those logs usingkubectl logs because they are not controlled
by the kubelet.Here are two example manifests that you can use to implement a sidecar container with a logging agent.
The first manifest contains a ConfigMap
to configure fluentd.
apiVersion: v1
kind: ConfigMap
metadata:
  name: fluentd-config
data:
  fluentd.conf: |
    <source>
      type tail
      format none
      path /var/log/1.log
      pos_file /var/log/1.log.pos
      tag count.format1
    </source>

    <source>
      type tail
      format none
      path /var/log/2.log
      pos_file /var/log/2.log.pos
      tag count.format2
    </source>

    <match **>
      type google_cloud
    </match>
Note:
In the sample configurations, you can replace fluentd with any logging agent, reading from any source inside an application container.The second manifest describes a pod that has a sidecar container running fluentd. The pod mounts a volume where fluentd can pick up its configuration data.
apiVersion: v1
kind: Pod
metadata:
  name: counter
spec:
  containers:
  - name: count
    image: busybox:1.28
    args:
    - /bin/sh
    - -c
    - >
      i=0;
      while true;
      do
        echo "$i: $(date)" >> /var/log/1.log;
        echo "$(date) INFO $i" >> /var/log/2.log;
        i=$((i+1));
        sleep 1;
      done
    volumeMounts:
    - name: varlog
      mountPath: /var/log
  - name: count-agent
    image: registry.k8s.io/fluentd-gcp:1.30
    env:
    - name: FLUENTD_ARGS
      value: -c /etc/fluentd-config/fluentd.conf
    volumeMounts:
    - name: varlog
      mountPath: /var/log
    - name: config-volume
      mountPath: /etc/fluentd-config
  volumes:
  - name: varlog
    emptyDir: {}
  - name: config-volume
    configMap:
      name: fluentd-config
Exposing logs directly from the application
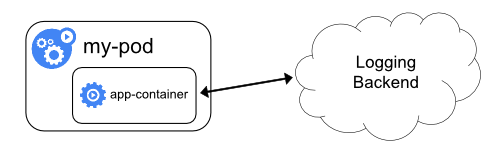
Cluster-logging that exposes or pushes logs directly from every application is outside the scope of Kubernetes.
What's next
- Read about Kubernetes system logs
- Learn about Traces For Kubernetes System Components
- Learn how to customise the termination message that Kubernetes records when a Pod fails