This article is more than one year old. Older articles may contain outdated content. Check that the information in the page has not become incorrect since its publication.
Hands On With Linkerd 2.0
Linkerd 2.0 was recently announced as generally available (GA), signaling its readiness for production use. In this tutorial, we’ll walk you through how to get Linkerd 2.0 up and running on your Kubernetes cluster in a matter seconds.
But first, what is Linkerd and why should you care? Linkerd is a service sidecar that augments a Kubernetes service, providing zero-config dashboards and UNIX-style CLI tools for runtime debugging, diagnostics, and reliability. Linkerd is also a service mesh, applied to multiple (or all) services in a cluster to provide a uniform layer of telemetry, security, and control across them.
Linkerd works by installing ultralight proxies into each pod of a service. These proxies report telemetry data to, and receive signals from, a control plane. This means that using Linkerd doesn’t require any code changes, and can even be installed live on a running service. Linkerd is fully open source, Apache v2 licensed, and is hosted by the Cloud Native Computing Foundation (just like Kubernetes itself!)
Without further ado, let’s see just how quickly you can get Linkerd running on your Kubernetes cluster. In this tutorial, we’ll walk you through how to deploy Linkerd on any Kubernetes 1.9+ cluster and how to use it to debug failures in a sample gRPC application.
Step 1: Install the demo app 🚀
Before we install Linkerd, let’s start by installing a basic gRPC demo application called Emojivoto onto your Kubernetes cluster. To install Emojivoto, run:
curl https://run.linkerd.io/emojivoto.yml | kubectl apply -f -
This command downloads the Kubernetes manifest for Emojivoto, and uses kubectl to apply it to your Kubernetes cluster. Emojivoto is comprised of several services that run in the “emojivoto” namespace. You can see the services by running:
kubectl get -n emojivoto deployments
You can also see the app live by running
minikube -n emojivoto service web-svc --url # if you’re on minikube
… or:
kubectl get svc web-svc -n emojivoto -o jsonpath="{.status.loadBalancer.ingress[0].*}" #
… if you’re somewhere else
Click around. You might notice that some parts of the application are broken! If you were to inspect your handly local Kubernetes dashboard, you wouldn’t see very much interesting---as far as Kubernetes is concerned, the app is running just fine. This is a very common situation! Kubernetes understands whether your pods are running, but not whether they are responding properly.
In the next few steps, we’ll walk you through how to use Linkerd to diagnose the problem.
Step 2: Install Linkerd’s CLI
We’ll start by installing Linkerd’s command-line interface (CLI) onto your local machine. Visit the Linkerd releases page, or simply run:
curl -sL https://run.linkerd.io/install | sh
Once installed, add the linkerd command to your path with:
export PATH=$PATH:$HOME/.linkerd2/bin
You should now be able to run the command linkerd version, which should display:
Client version: v2.0
Server version: unavailable
“Server version: unavailable” means that we need to add Linkerd’s control plane to the cluster, which we’ll do next. But first, let’s validate that your cluster is prepared for Linkerd by running:
linkerd check --pre
This handy command will report any problems that will interfere with your ability to install Linkerd. Hopefully everything looks OK and you’re ready to move on to the next step.
Step 3: Install Linkerd’s control plane onto the cluster
In this step, we’ll install Linkerd’s lightweight control plane into its own namespace (“linkerd”) on your cluster. To do this, run:
linkerd install | kubectl apply -f -
This command generates a Kubernetes manifest and uses kubectl command to apply it to your Kubernetes cluster. (Feel free to inspect the manifest before you apply it.)
(Note: if your Kubernetes cluster is on GKE with RBAC enabled, you’ll need an extra step: you must grant a ClusterRole of cluster-admin to your Google Cloud account first, in order to install certain telemetry features in the control plane. To do that, run: kubectl create clusterrolebinding cluster-admin-binding-$USER --clusterrole=cluster-admin --user=$(gcloud config get-value account).)
Depending on the speed of your internet connection, it may take a minute or two for your Kubernetes cluster to pull the Linkerd images. While that’s happening, we can validate that everything’s happening correctly by running:
linkerd check
This command will patiently wait until Linkerd has been installed and is running.
Finally, we’re ready to view Linkerd’s dashboard! Just run:
linkerd dashboard
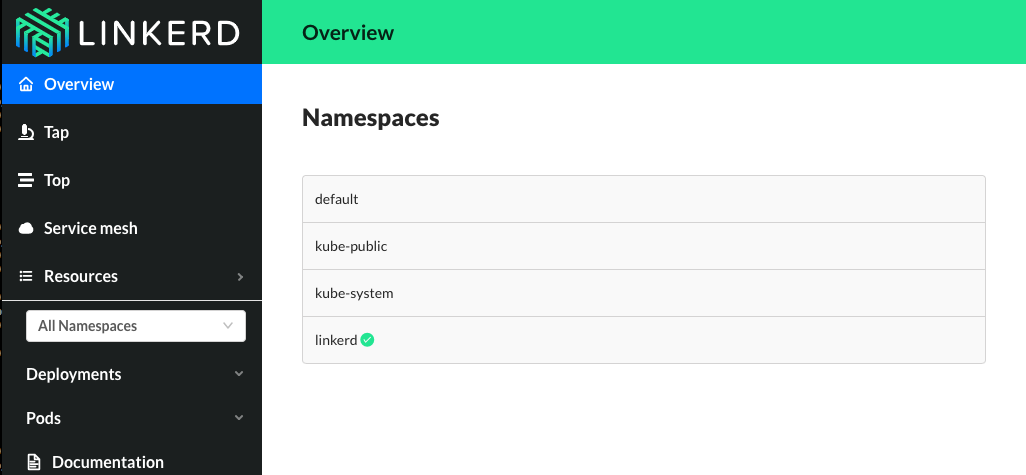
If you see something like below, Linkerd is now running on your cluster. 🎉
Step 4: Add Linkerd to the web service
At this point we have the Linkerd control plane installed in the “linkerd” namespace, and we have our emojivoto demo app installed in the “emojivoto” namespace. But we haven’t actually added Linkerd to our service yet. So let’s do that.
In this example, let’s pretend we are the owners of the “web” service. Other services, like “emoji” and “voting”, are owned by other teams--so we don’t want to touch them.
There are a couple ways to add Linkerd to our service. For demo purposes, the easiest is to do something like this:
kubectl get -n emojivoto deploy/web -o yaml | linkerd inject - | kubectl apply -f -
This command retrieves the manifest of the “web” service from Kubernetes, runs this manifest through linkerd inject, and finally reapplies it to the Kubernetes cluster. The linkerd inject command augments the manifest to include Linkerd’s data plane proxies. As with linkerd install, linkerd inject is a pure text operation, meaning that you can inspect the input and output before you use it. Since “web” is a Deployment, Kubernetes is kind enough to slowly roll the service one pod at a time--meaning that “web” can be serving traffic live while we add Linkerd to it!
We now have a service sidecar running on the “web” service!
Step 5: Debugging for Fun and for Profit
Congratulations! You now have a full gRPC application running on your Kubernetes cluster with Linkerd installed on the “web” service. Of course, that application is failing when you use it--so now let’s use Linkerd to track down those errors.
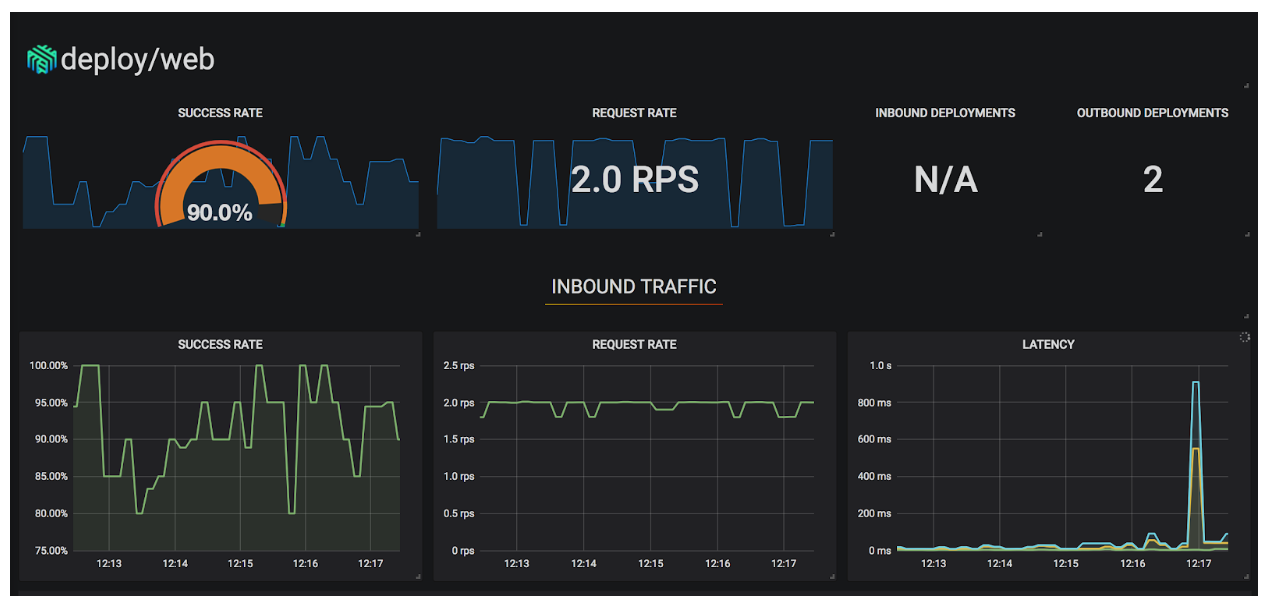
If you glance at the Linkerd dashboard (the linkerd dashboard command), you should see all services in the “emojivoto” namespace show up. Since “web” has the Linkerd service sidecar installed on it, you’ll also see success rate, requests per second, and latency percentiles show up.
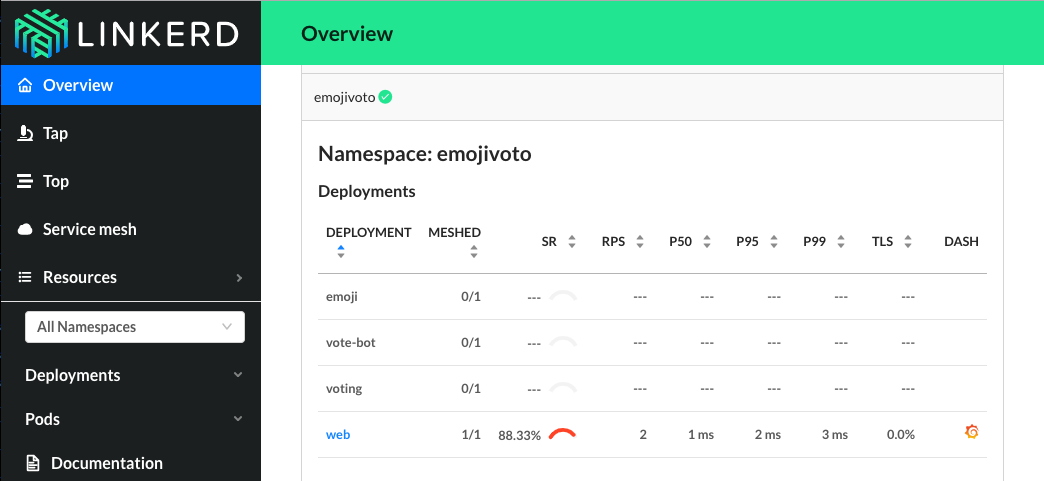
That’s pretty neat, but the first thing you might notice is that success rate is well below 100%! Click on “web” and let’s dig in.
You should now be looking at the Deployment page for the web service. The first thing you’ll see here is that web is taking traffic from vote-bot (a service included in the Emojivoto manifest to continually generate a low level of live traffic), and has two outgoing dependencies, emoji and voting.
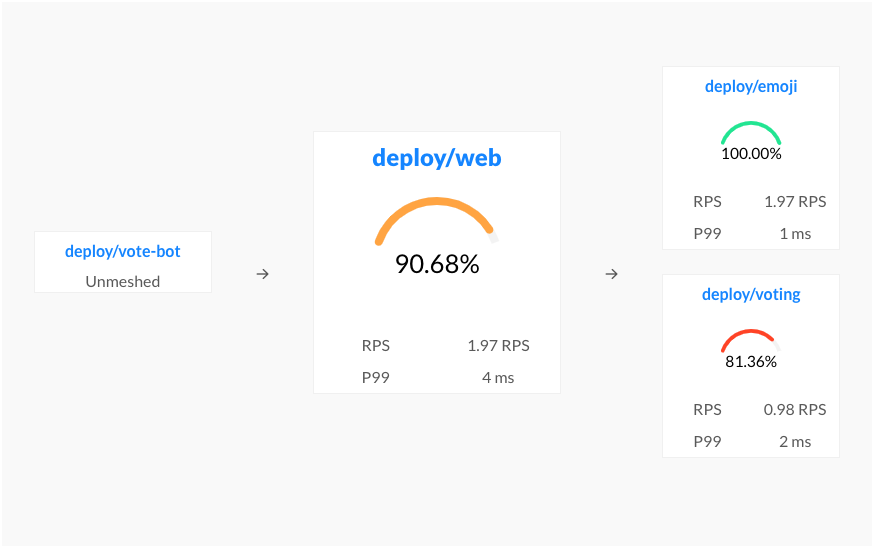
The emoji service is operating at 100%, but the voting service is failing! A failure in a dependent service may be exactly what’s causing the errors that web is returning.
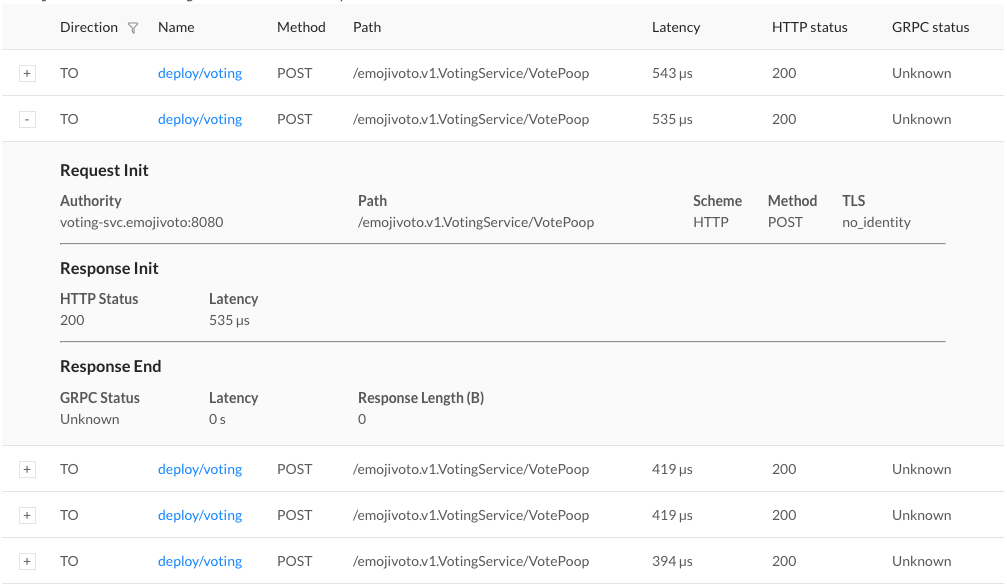
Let’s scroll a little further down the page, we’ll see a live list of all traffic endpoints that “web” is receiving. This is interesting:
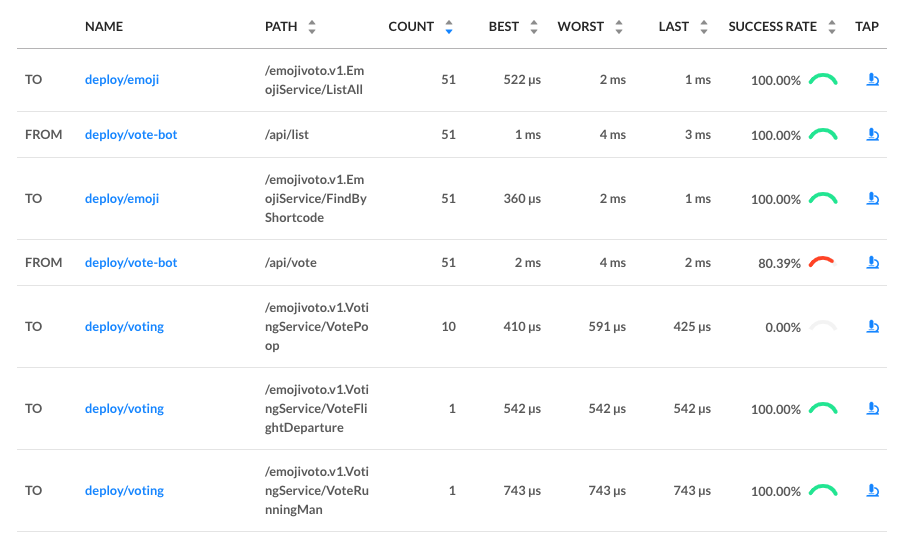
There are two calls that are not at 100%: the first is vote-bot’s call the “/api/vote” endpoint. The second is the “VotePoop” call from the web service to the voting service. Very interesting! Since /api/vote is an incoming call, and “/VotePoop” is an outgoing call, this is a good clue that the failure of the vote service’s VotePoop endpoint is what’s causing the problem!
Finally, if we click on the “tap” icon for that row in the far right column, we’ll be taken to live list of requests that match this endpoint. This allows us to confirm that the requests are failing (they all have gRPC status code 2, indicating an error).
At this point we have the ammunition we need to talk to the owners of the vote “voting” service. We’ve identified an endpoint on their service that consistently returns an error, and have found no other obvious sources of failures in the system.
We hope you’ve enjoyed this journey through Linkerd 2.0. There is much more for you to explore. For example, everything we did above using the web UI can also be accomplished via pure CLI commands, e.g. linkerd top, linkerd stat, and linkerd tap.
Also, did you notice the little Grafana icon on the very first page we looked at? Linkerd ships with automatic Grafana dashboards for all those metrics, allowing you to view everything you’re seeing in the Linkerd dashboard in a time series format. Check it out!
Want more?
In this tutorial, we’ve shown you how to install Linkerd on a cluster, add it as a service sidecar to just one service--while the service is receiving live traffic!---and use it to debug a runtime issue. But this is just the tip of the iceberg. We haven’t even touched any of Linkerd’s reliability or security features!
Linkerd has a thriving community of adopters and contributors, and we’d love for YOU to be a part of it. For more, check out the docs and GitHub repo, join the Linkerd Slack and mailing lists (users, developers, announce), and, of course, follow @linkerd on Twitter! We can’t wait to have you aboard!